


879
On the performance of arc flash analysis in DC power systems
Direct current (DC) arcing fault incident energy calculations are presented to assess the level of risk involved when working around high current DC apparatus. The proposed procedure allows evaluation of incident energy and arc flash boundaries, while taking into account as many circuit parameters as possible. These parameters include fixed or variable gap length, system voltage, available fault current, equipment configuration, circuit time constant and evaluated threshold energy for a second degree burn.
DC Arc Steady State Modeling
The resistance load line of the equivalent steady state circuit diagram representing a linear DC supply can be described by Equation (1) below:
where Vs stands for open source voltage and Rs is system resistance including source and feeders. The applications include battery packs, power converters and chargers, mining sites, public transportation, solar and wind farms etc. Substituting into the Equation (1) voltage drop across an arc (Varc), arcing current can be resolved as:
where Isc is prospective short circuit current at the arcing point. It is shown that arc voltage is mainly determined by the arc length, and the voltage is within the 10 to 20V/cm range for arc currents up to the order of 50kA [1]. Incident energy exposure for an open-air arc where the heat transfer depends on the spherical energy density is then expressed as:
where tarc is the arc duration and D represents the distance from the arc. This formula assumes the radiant heat transfer. Not all of the arc energy will be transferred as radiant heat [2] especially within the short time interval after the arc was ignited. Therefore, the Equation (3) will produce a conservative but safe estimate of incident energy exposure. For the arc in a box, the enclosure has a focusing effect on the incident energy. For the selected enclosure type and test distance [3], the incident energies calculated for enclosures are 2.2 times larger than the incident energies calculated for open air.
Equation (3) written in terms of arc flash boundary, becomes:
where Et stands for threshold incident energy to second degree burn [4] evaluated as:
DC Arc Transient Conditions
The problem of determining the arc flash boundary becomes less trivial when gap is not fixed and distance between anode and cathode is anticipated to increase by separation of the contacts. Also, the arc operates at the intersection of the arc volt-ampere characteristic curve and the resistance load line of the DC circuit. Therefore, the arcing current will stabilize itself at a fixed point on the curve and the arc will dissipate a relatively constant amount of power. However, it's hard to predict how long it will take for the arcing current to stabilize before the arc burns out or is cleared by the upstream protective device. The load line may intercept the characteristic curve in two locations, but only one point is stable. The stable operating location is the point with the lowest arc voltage [5].
Stokes and Oppenlander [3] demonstrated that there is a minimum voltage needed to maintain an arc. That minimum depends on the current magnitude, gap width, and orientation of the electrodes. This transitional point can be expressed as:
where the length of the gap, Zg, is expressed in mm., It is measured in amperes. Above that minimum, the arc V-I characteristic can be expressed as [3]:
To find the point where the arc V-I characteristic crosses the circuit load line, solve equations (2) and (7) using the iterative method. As the first approximation, assume Varc is equal to half of the system voltage Vs. Then, follow the steps below:
- determine Iarc from Equation (2)
- substitute Iarc into Equation (7) to determine new Varc
Cycle through the steps listed above until the answers for Varc converge. Additionally, circuit time constant affects current rise and protective device performance characteristics, thus impacting the arc duration. In this case, time current characteristic of the upstream protective device clearing the fault may have to be adjusted for the time constant. If this occurs, the process of determining the protective device operating time is cumbersome. First, the time-current characteristic of the protective device has to be analytically expressed as a function of the available fault current. A paper by Cynthia Cline [6] provides an equation describing the relationship between the effective RMS current, the available fault current, and the number of time constants:
where the K factor is expressed in numbers of time constants n = tarc/tconst:
This creates a dilemma due to the fact that one cannot determine the arcing time without the RMS value of the arcing current, and one cannot solve for the RMS current without the arcing time represented by the n term in Equation 9. This requires an iterative solution. As a first approximation, begin by assuming that Irms equals Iarc, determining tarc from the analytical expression for the fuse T-C characteristics tarc=f(Irms), determining the number of time constants n and calculating K from Equation 9, substituting its value into Equation 8 to calculate the new RMS current, and then solving for the arc duration again. Once the first approximation of the arc duration has been made, determine the new number of time-constants n, re-calculate the K term and substitute its value into Equation 8. This produces a new Irms. Re-calculate for a new tarc by using the new Irms and continue until the answers converge. Then, Equations (3) through (5) can be utilized to complete the DC arc analysis under the transient conditions.
Generalized Solution
With numerous variable parameters on hand, which results in the difficulty to accurately model DC arc and to predict the arc V-I characteristic and thermal behavior, we decided to consider the worst case scenario leading to an arbitrary burn hazard in the shortest possible time. Figure 1 shows arcing power as a function of variable arcing current for the DC equivalent circuit described by Equation 1. The red line on Figure 1 represents time to 2nd degree burn as a function of heat flux [4]. Note that the minimum time to 2nd degree burn, as well as any other burn hazard, coincides with the maximum power released by an arc, hence, the maximum heat flux.
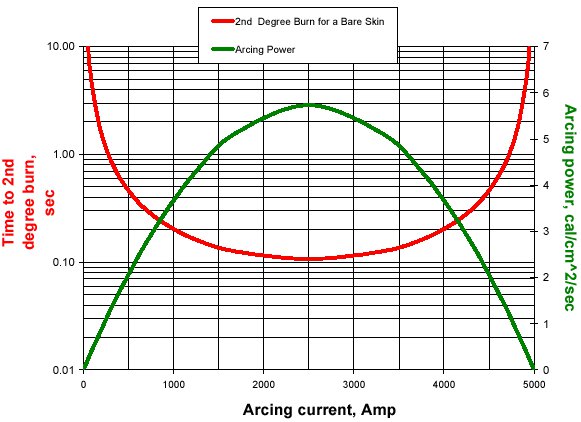
Figure 1. Sample arcing power and time to 2nd degree burn vs. arcing current at 0.5 meter distance away from arc in open air 600 VDC system.
For a fuse with an inverse time-current characteristic, the amount of arcing currents is inversely correlated with the fuse operating time, and consequently, with the arc duration. With the decrease of arcing current, power released by an arc will actually increase and reach its maximum value corresponding to the middle point on Figure 1. Further decrease in arcing current will lead to a decrease in arcing power and an increase in arc duration time when it takes more time for the upstream protective device to clear the fault. Therefore, there is a minimum amount of time leading to a specified burn severity produced by any given DC arc, and, for the 2nd degree burn on bare skin, that time can be expressed as:
where Eb is equal to 1.2 cal/cm2/sec. The Equation (10) assumes rectangular flash pulse, thus producing the minimum time to 2nd degree burn under the specified circuit conditions. It can also be applied for hazards other than 2nd degree burn by selecting a different Eb factor on the right side of the Equation 10. When analytical expression for the protective device clearing the fault time-current characteristic is available, it is possible to examine power and energy released by an arc as a function of arcing current and arc resistance, and to determine maximum damage that can be caused by the arc during the selected time interval. A simplified block diagram on Figure 2 below describes the proposed approach for calculating incident energies and for determining arc flash boundaries in DC power systems:
Figure 2. Simplified block diagram for resolving arcing faults in DC power systems.
Summary
With a better understanding of the DC circuit parameters and the DC capabilities of fuses, modeling DC arcs and selecting appropriate fuses for mitigating arc flash hazard can be accomplished without much difficulty. The generalized solution presented in this paper considers the worst case scenario, effectively eliminating the need for accurately predicting arcing gap and arc resistance.
References:
- Electric Arcs and Arc Interruption. CE Solver. Chalmers University of Technology. February 2005
- Electric Power Transmission Systems. 2nd Edition. J.Robert Eaton, Edwin Cohen. Prentice-Hall, Inc.
- DC Arc Models and Incident Energy Calculations. R. Ammerman, T. Gammon, P.K. Sen, J. Nelson. IEEE Transactions on Industry Applications, Vol. 46, No. 5, September/October 2010
- Evaluation of Onset to Second Degree Burn Energy in Arc Flash. M. Furtak, L. Silecky. Electrical Safety Measures. March/April 2012
- Arcing Faults on Direct Current Trolley Systems. P. Hall, K Myers and W. Vilchek. Mine Safety and Health Administration
- Fuse Protection of DC Systems. Cynthia Cline. Annual Meeting of the American Power Conference. April 1995
Source
Published in IAEI magazine (November-December 2012) [click to open]
Copyright © 2019 ARCAD INC. All rights reserved.